
A Guide to Moving Averages in Trading
Open up a trading chart and look at it. At first, you can see if prices are moving up or down, but it’s hard to actually understand what’s going on. Even if the market experiences a rally, that doesn’t necessarily mean that things are looking good for buyers across the big picture.
Moving averages are among the most popular and straightforward indicators you can use to get a sense of trends. It tracks down the average price of a stock across a selected number of days and removes the noise. With it, you’re able to effectively identify where the winning side is and prepare how you respond to it.
Meaning: What are Moving Averages
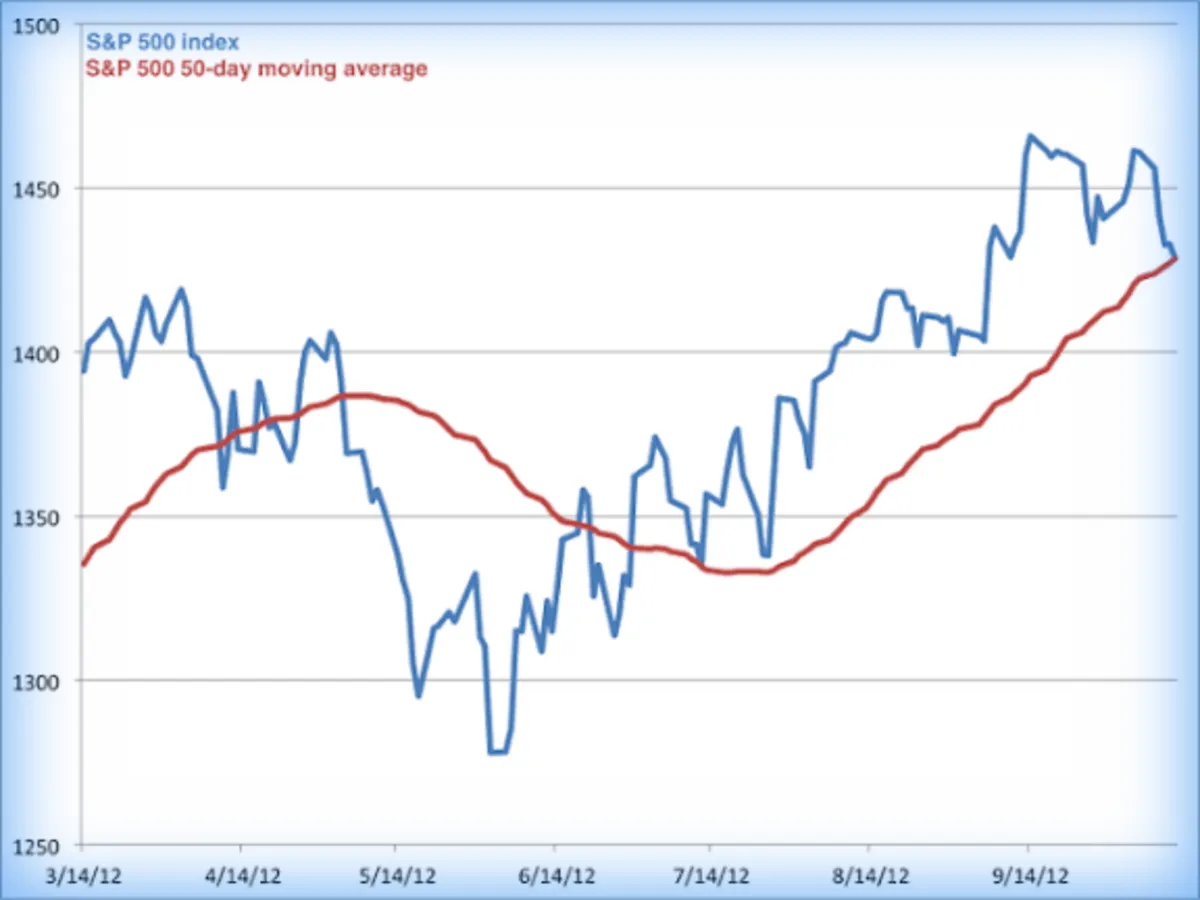
A moving average is an updated average price from a stock, or any other historical data, captured across a defined period of time. On stock markets, it generally refers to the average closing price, although the same concept can be easily adapted to open, high, and low in indicator settings across different trading platforms.
If we consider a 10-day MA, what we’re doing essentially is adding the last 10 closing prices and dividing the total by 10. As soon as the following day closes, we remove the oldest closing data, add the newest one, and recalculate. This process creates a rolling average that moves forward along with the market, and this is where the word moving comes from in this context.
Generally, people use moving averages to smooth price action. Remove the noise and identify the direction of the trend.
These averages also work as dynamic support and resistance levels. If the price is above a rising MA, we get a bullish bias. If the price is below a declining MA, we get a bearish bias.
Although a very useful indicator when it comes to translating market noise to information (i.e., trend), the biggest weakness of moving averages is that they are a lagging indicator. A sharp rally can start way before a moving average turns upward, as well as a selloff can develop much before a long-term line begins to point downward.
In essence, the indicator works best as a trend filter.
EMA x SMA and The Different Types of Moving Averages
| Weighting | Trait | |
| SMA | Every observation has the same weight | Slower response. Smoother |
| EMA | Recent data has greater weight | Faster response to recent price changes |
| WMA | Decreasing linear weights | More sensitive than an SMA |
| VWMA | Weights price by trading volume | Focuses on market participation |
Simple Moving Average
SMA = (P1 + P2 + … + PN) / N
Very straightforward. Every input has the exact same weight.
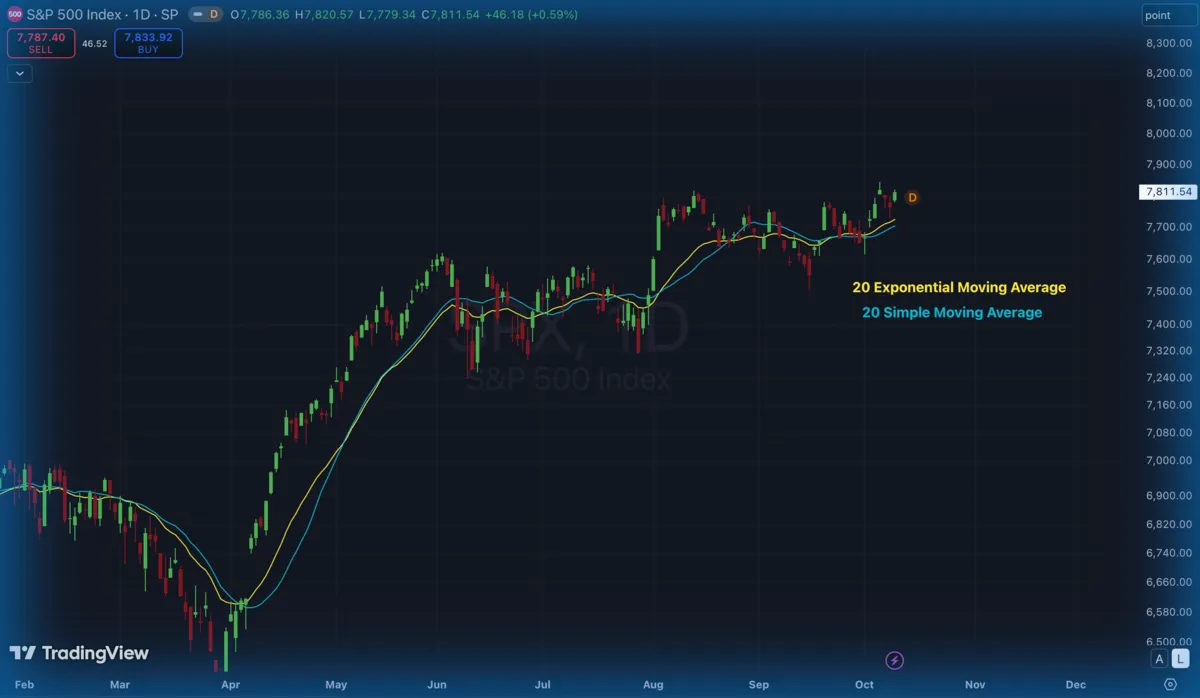
Many people prefer an SMA for longer-term analysis because it reacts less aggressively to individual price spikes. The slower response makes it more stable and less influenced by short-term noise.
Exponential Moving Average
EMAₜ = (Pₜ × α) + (EMAₜ₋₁ × (1 − α))
For an N-period EMA:
α = 2 / (N + 1)
Don’t get intimidated by the math. The concept here is simple, the exponential moving average gives more importance to the most recent price action.
Short-term traders will often prefer EMAs because the faster response produces earlier signals, so it’s more dynamic. The cost comes through additional sensitivity, which creates more false signals during choppy sessions.
Weighted and Volume-Weighted Moving Averages
VWMA = Σ(Pᵢ × Vᵢ) / ΣVᵢ
In general, a weighted moving average is defined by one that assigns different weights across the period. The weighting in question varies according to the strategy.
A volume-weighted moving average, also known as VWMA, focuses on weighting price according to the trading volume. The idea here is that price action backed by stronger market participation, which is measured through volume, holds more significance than movements with lower participation.
The VWMA is especially appealing during breakouts and other volatile periods. If it acts like a support level, but the volume isn’t that strong, then it opens up space to question whether that level can actually hold prices or drive them higher, for example.
The Different Moving Average Periods
The number attached to a moving average tells you how many periods are a part of the calculation (e.g., 9-EMA, 20-SMA, 50-VWMA, etc.). Shorter windows follow price movement more closely, whereas longer windows smooth out noise and react more slowly, making them more reliable for long-term trends.
| Period | Common Use | General Behavior |
| 9-10 | Short-term | Fast and sensitive |
| 20-21 | Monthly view | Moderate response to price action |
| 50 | Medium-term | Balanced |
| 100 | Longer trend confirmation | Slow |
| 200 | Major long-term | Much slower. It’s the most watched period for traders and investors alike, as well as institutional players. |
How Traders Use Moving Averages on a Chart
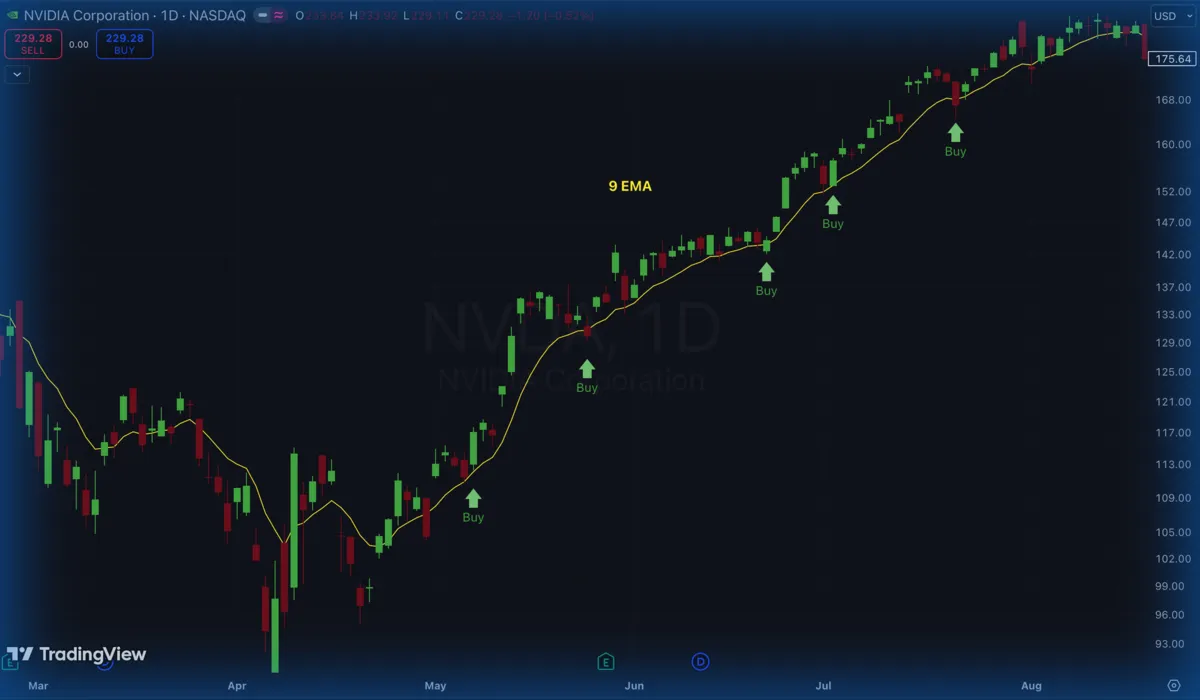
The most straightforward way of using moving averages on a price chart is finding the trend and going along with it. Since they act as dynamic support and resistance levels, you can use them as entry points in a trend-following strategy. When prices pullback to it in a bull market, you go long.
Another strategy focuses on using crossovers. So traders use two moving averages at the same time, a fast line and a slow line:
- A short-term MA crosses above a longer-term MA -> Bullish crossover
- A short-term MA crosses below a longer-term MA -> Bearish crossover
We’re gonna talk more about it in the next session.
The Golden Cross and the Death Cross
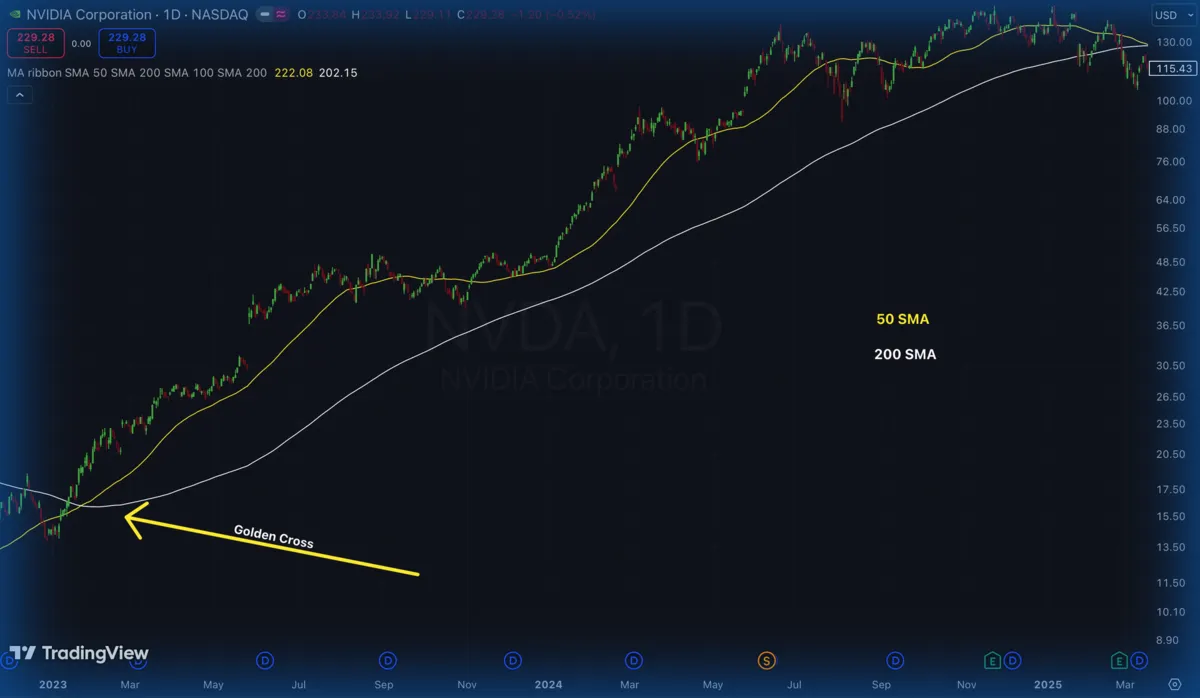
The Golden Cross is one of the most important and well-known moving average crossovers in financial markets. It happens when a 50-simple move average crosses above the 200-simple moving average. This is interpreted as a massive bullish long-term signal.
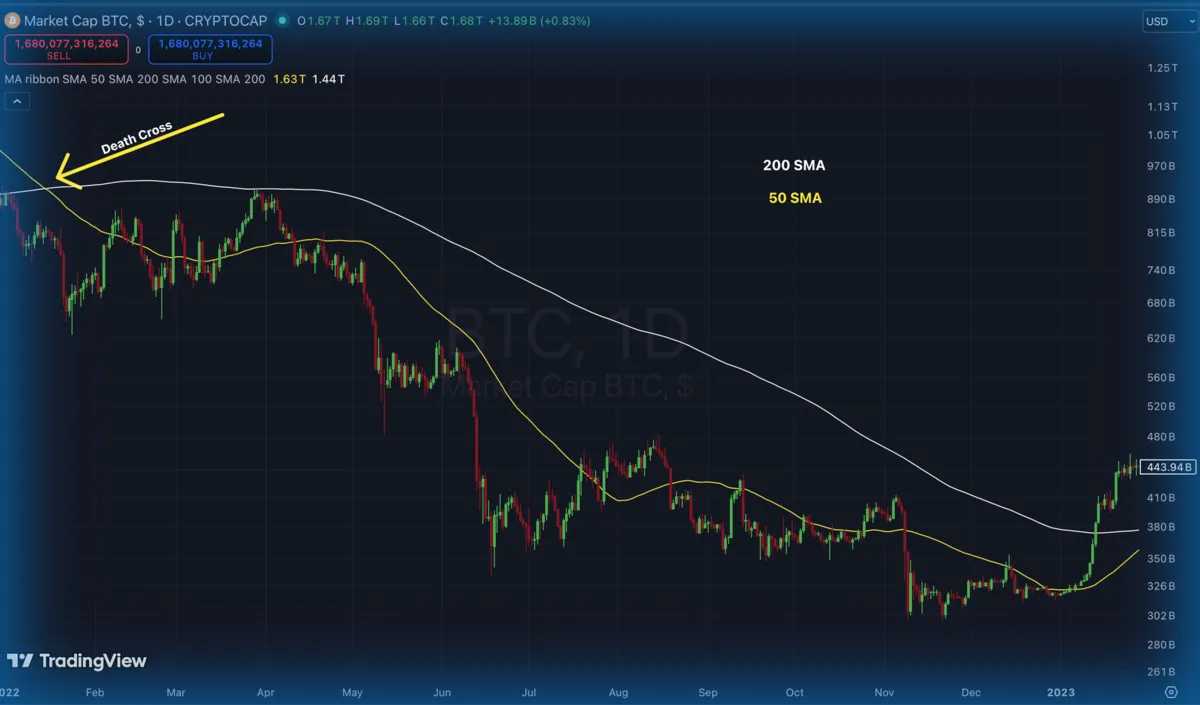
On the other hand, a Death Cross happens when a 50-day moving average falls below the 200-day moving average. This is a sign of downwards price movements in the long-term.
These patterns are so powerful because pretty much everybody’s paying attention to these periods. The 200-moving average is used by institutional players when optimizing their long-term investment goals. On the other hand, retail traders are constantly using the 50 and 200 moving averages as important technical analysis tools for their trading decisions.
For this reason, these crossovers turn into a self-fulfilling prophecy kind of thing. Over 90% of market participants see them as a buy or sell signal.
What is a MACD
The MACD indicator is one of the most popular technical indicators derived from moving averages. It is used mostly to track momentum. So, it is based on analyzing the relationship between a faster and a slower moving average, very similar to the concept I have already approached before in this article.
The default setting has a 12 period EMA and a 26 period EMA and the difference between them forms the MACD line, and a 9 period EMA of that line produces the buying and selling signal for technical analysts.
Most people use it to watch for convergence, divergence, and crossovers between the 2 EMAs. This indicator is essentially a couple of steps toward a more complex system using moving averages, but for beginners I think having two moving averages on a price chart is a better choice due to it being more comprehensible.
Which is the Best MA for Trend Trading
There is no absolute best here. Moving averages are very adaptable and dynamic and that’s one of the reasons why they’re used by technical analysts across many markets, assets, and timeframes.
In general, what we could do here is segregate them into a couple of types and understand where each would be more adequate.
For faster signals, we could use EMAs or WMAs. But as a caveat, you gotta be aware that faster lines tend to produce more whipsaws when price moves sideways.
For a long-term trend analysis, longer SMAs provide a much cleaner picture. This is why many people use a 200-day simple moving average to define the long-term direction of the market.
And of course, it’s always a good idea to combine different moving averages. You don’t want to have a bunch of them on your trading chart, but it tends to be a good idea to have at least two of them. So you can use a short-term EMA to generate entry signals while a 50 SMA confirms the broader direction and bias.
When I first started trading Futures, this is the framework that I used and I found it very easy to understand and kept it for a long time because it worked really well:
- 9 EMA for short-term momentum and price action decisions.
- 20-day SMA as a mid-term trend filter.
As you keep trading and developing your system, you will eventually find the combination that works best for you. But if you’re just starting swing trading on stock markets, I believe that the framework above is definitely a great start.
Moving Average Trading Strategies and When MAs Don’t Work
As a trend-following indicator, moving average strategies perform best when the market already has a clear trend established. When it consolidates within a range, that’s when things become difficult.
When prices keep swinging up and down the average, you’ll find that it produces a lot of losing signals for your trades. Faster moving averages like the EMA become way too reactive to noise and also produce false signals, so you gotta watch out for that as well.
As a lagging indicator, they are also vulnerable to sudden shocks. MAs become easily distorted when we have market shocks from unexpected earnings, policy announcements, wars, news, geopolitical events, etc…
Pairing moving averages with other tools is highly important. I particularly think that volatility indicators help a lot in filtering out weak setups and I believe the Bollinger Bands represent a natural enhancement to a beginner’s trading system based on moving averages. I definitely suggest you start taking a look into that as well.
How to Add an MA to a Trading Chart
It’s really easy. Pretty much every single charting platform gives you the option to add moving averages from all different types onto your charts. If your platform somehow doesn’t give you this option, ditch it and find a better one.
On TradingView, MetaTrader, or any other interface the process tends to be the same:
- Open the Indicators menu
- Search for Moving Average, SMA, EMA, VWMA, etc.
- Select the preferred type
- Enter the period (9, 20, 50, 200)
- Adjust the price source or visual settings whenever you need to
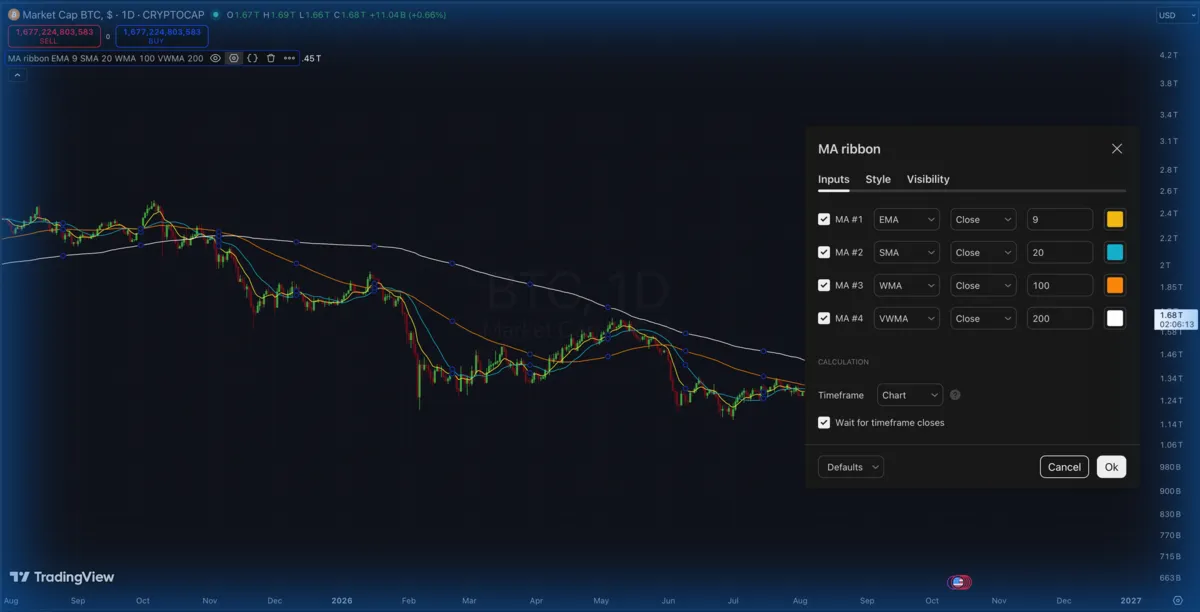
My favorite moving average indicator on TradingView is the MA Ribbon, which allows you to choose different moving averages, types, and periods all at once while only taking the spot of one single indicator, which is extremely helpful if you’re not on a paid plan.
Conclusion
Moving averages are definitely among the simplest and most straightforward indicators used in technical analysis. They make wonderful use of price data to help you identify trends and weaken the noise caused by short-term volatility.
These tools are extremely versatile and work very well across different market types and they offer several settings you can tweak to your liking, such as trying different time periods or calculation methods.
I hope you found this article helpful, and if you’re a beginner, I highly suggest you start your trading journey by employing at least two moving averages on your charting platforms. This way you will be able to make better readings of market information.
Build a trading Journal, analyze, adapt, iterate. Keep moving forward.