
If you have been trading financial markets for long enough, you’re well aware that you don’t get the full story by looking only at the price. But what separates newbies from experienced traders is the understanding that volume matters.
Price action is significant as long as it is backed by market participation. And it is measured through trading volume.
There are 2 indicators widely used to help you gauge market overturn: the VWAP, Volume-Weighted Average Price, and the VWMA, Volume-Weighted Moving Average.
They’re both reliant on the price x volume relationship. But the way they calculate things makes them work differently and useful in different situations.
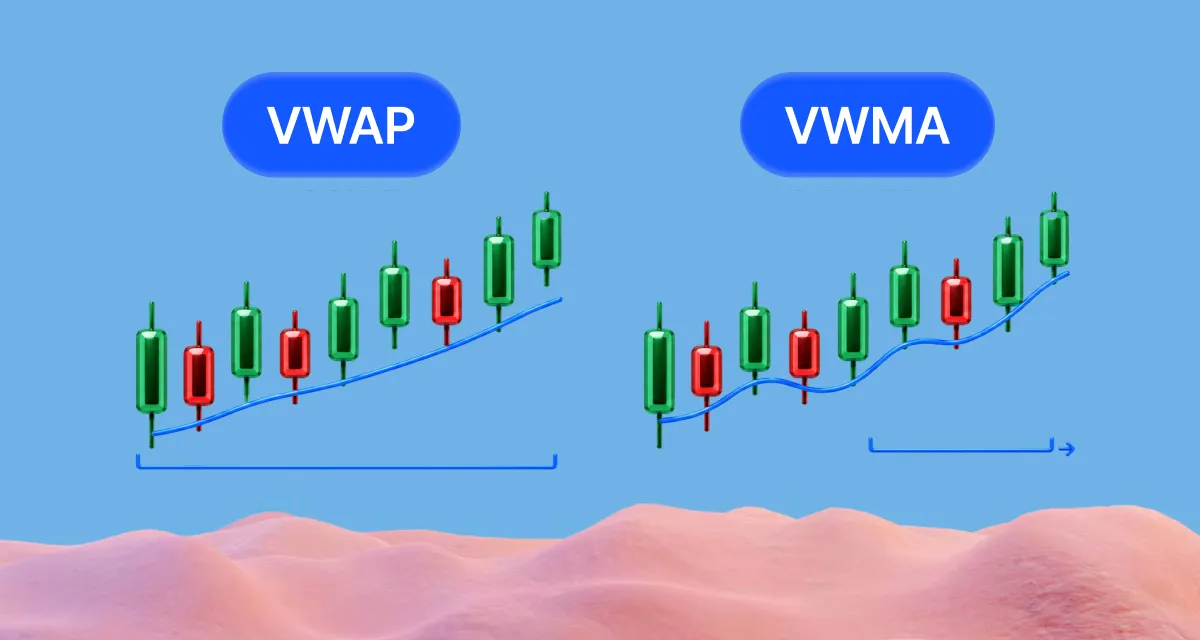
With the VWAP, we’re looking at the accumulation of data from the start to the end of each trading session. It then resets the next morning
With the VWMA, we’re looking at a moving average calculated over a fixed number of candles. It keeps moving forward as new candles come in, without ever resetting.
Now which option is the best one among VWAP vs VWMA? The best bet actually depends on your preferred timeframe and trading system.
Intraday traders can definitely see the benefits of using the VWAP. But swing traders will find the VWMA valuable for long-term trend analyses.
Think of the VWMA like a moving average. When you look at it on a graph, you’ll notice it doesn’t look any different from an SMA or an EMA.
But the difference is that it gives more importance to candlesticks backed by higher trading volume.
For each candle, we multiply its closing price by its volume.
We sum those values together across a number of candles (for example, 10 candles for a 10-period VWMA).
We then divide the result by the total volume traded over the lookback.
VWMA(N) = Σ(Close × Volume) / Σ(Volume)
High-volume candles exercise more impact in the final value than low-volume candles. The idea is that the average is backed by stronger market turnover, giving more emphasis to moves that are considered more meaningful.
Since the VWMA doesn’t reset at the start of each day, the lookback window rolls forward with every new candle, so you can use it across different timeframes – intraday, daily, or even weekly charts.
Traders in general interpret the VWMA the same they would a conventional moving average:
- Upward VWMA = bullish trend.
- Downward VWMA = bearish trend.
- Flat VWMA = sideways market, neither bulls nor bears are winning.
- Crossovers = possible changes in momentum.
The VWAP measures the average traded price weighted by trading volume.
But it differs from the VWMA and other moving averages on the basis that it only works for the current trading session.
VWAP = ∑(Volume x Price) / ∑(Volume)
At the next trading session, the computation resets and starts over again.
Day traders find the VWAP useful to highlight the directional bias of the session. The interpretation is very straightforward. When the price is above the VWAP, the market is bullish and likely to keep moving upwards. When the price is traded below the VWAP, the market is bearish and more likely to keep moving downwards.
Since it’s used as a trend tracker, it also becomes a dynamic support or resistance line. That’s because traders will keep buying near it when the market is bullish, and short it when the market is bearish.
But not only day traders use the VWAP. Institutional players have it as the main execution benchmark for the intraday. Their goal is to reach the session’s end with an average price below the market’s average, measured by the VWAP, to make their entry price more favorable.
The difference in how they’re computed results in different behaviors, as you can see below.
| VWAP | VWMA | |
|---|---|---|
| Calculation | Cumulative from session start | Rolling across X bars |
| Volume weighting | Yes | Yes |
| Reset | Resets everyday | No daily reset |
| Timeframe | Intraday | Any timeframe |
| Chart behavior | Session average | Rolling average |
| Typical use | Intraday support and resistance levels, plus benchmarking | Long-term trend and momentum analysis |
Let’s take a look at some real-world scenarios and understand how a trader would typically use each indicator.
VWAP
So, when we use the VWAP, we’re using intraday charts. The large majority of day traders tend to operate on 5, 15, 30, and 60-minute charts.
The most straightforward way of using it is as a directional filter. If prices are above a rising VWAP, you would want to go long. If prices are below a falling VWAP, you would want to go short.
The goal is to wait for pullbacks near the indicator, so you can position yourself in the direction of the trend while keeping a cheap stop loss.
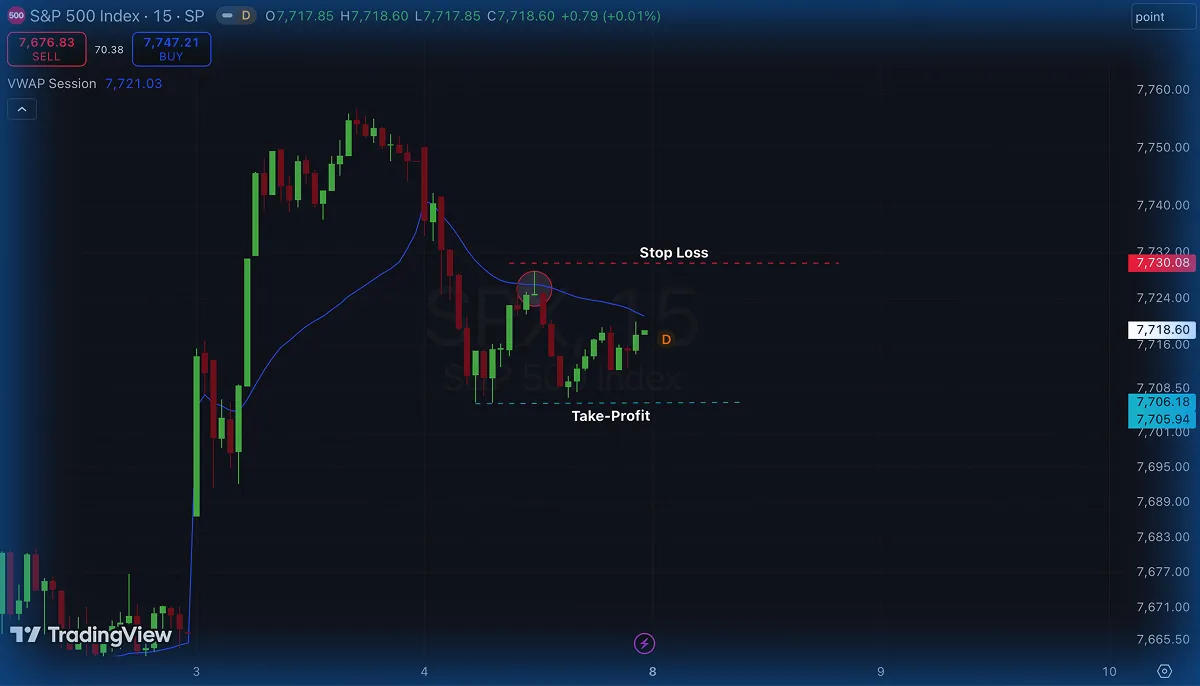
In the example above, we’re looking at S&P 500 Futures, 15-minutes chart.
Since we’re observing a falling VWAP and prices below it, we look towards pullbacks to enter short. The circled candle in the chart resembles a Shooting Star, a bearish candlestick pattern. Since it forms at the VWAP’s blue line, acting as a dynamic resistance level, it give us a reason to go short, betting that prices will keep moving down during the session.
In this specific scenario, we’d have a stop loss slightly above the highest point of the Shooting Star, at around 7,730.08 with a take-profit at at least the previous bottom, near 7,705.
VWMA
The main advantage of the VWMA is that it can be used across longer timeframes.
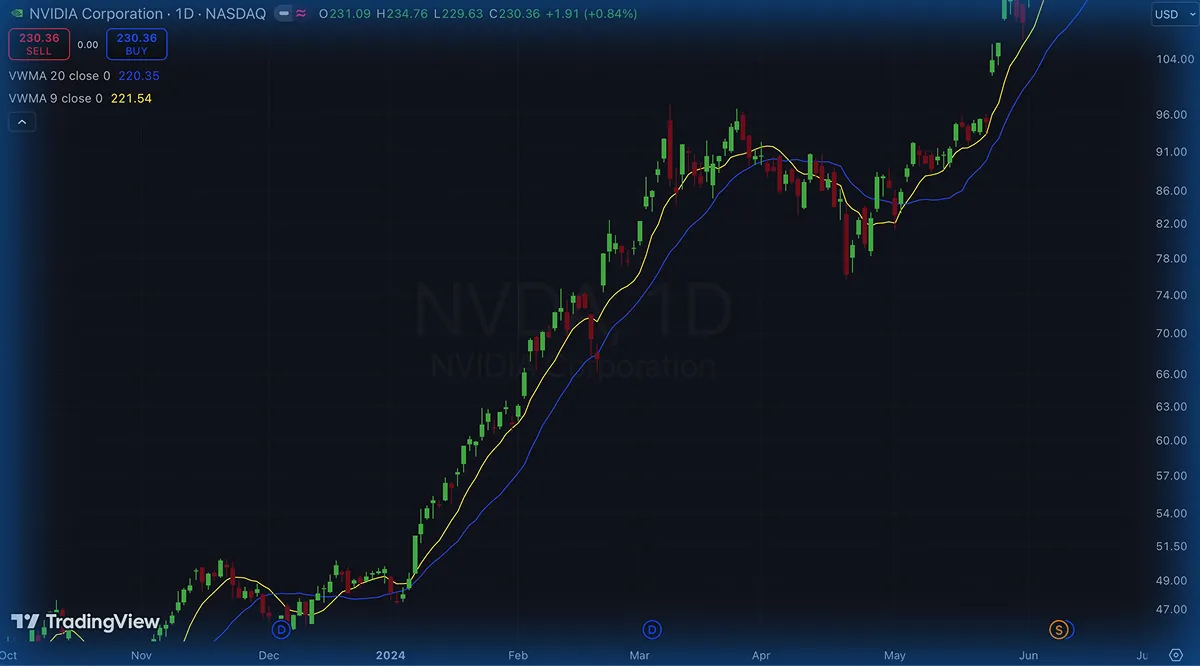
As you can see above, in the daily chart for Nvidia shares, the VWMA behaves very similarly to a simple moving average.
With this in mind, there are many ways you can use it in your trading system.
The easiest way to use it is to identify the main trend. In the example, we can see prices trading above the indicator which also happens to be pointing upwards. So we should seek buying opportunities.
The VWMA also works as a dynamic support level here, so you can aim at buying shares whenever the price is near the indicator.
You can also notice how I’m using 2 VWMAs. This allows me to evaluate the interaction between a fast and a slow average, making crossovers useful for entries and exits.
Given how strong the trend is in the example, I would look for opportunities to buy shares whenever prices were trading in between both VWMAs. This strategy could give us a cheap stop loss and great opportunity for using a trailing stop for as long as the trend lasts, a great risk-reward ratio.
You don’t have to think of these two indicators as opposites, especially when they work so well together.
You can, for instance, highlight an upward VWMA on a daily chart to establish a bullish bias. You would then use the intraday chart for your entry trigger. When price action approaches the VWAP, your entry position can yield a cheap stop loss and a longer space to let profits run along the trend.
Don’t hesitate to add in more technical analysis tools, such as RSI vs Stochastic Oscillator. Momentum improves the reliability of signals in a VWAP + VWMA trading system.
The choice honestly depends on what your trading system is targeted at.
Pick the VWAP if your focus is on intraday trading. Day traders and scalpers use it on a daily basis for trend assessment, pullbacks, mean reversion, and execution analysis.
Pick the VWMA if you prefer having a volume-focused moving average that continues across sessions. This one is particularly useful for swing traders, position traders, and trend-following investment strategies.
As a rule of thumb:
- Intraday average value and mean reversion → VWAP
- Trend assessment across multiple sessions → VWMA
- Higher-timeframe trend plus intraday entries → VWMA and VWAP together
You must be aware that no indicator predicts the future. Both the VWAP and VWMA look at historical price and volume data to transform them into a number. Treat both of these as signals within a broader context, they’re not a guarantee of gains.
The VWAP itself comes with several limitations.
Daily resets imply you can’t reliably use it for long-term trend assessment. Rallies and sell-offs can keep the price detached from it for long periods of time, making mean-reversion strategies particularly dangerous.
If your thing is scalping in Forex, you should know that particular settings across platforms reduces the VWAP’s reliability by a large chunk.
The VWMA on the other hand comes with risks typically associated with moving averages.
A short lookback period can result in lots of false signals, while a longer lookback can react too slowly to trend reversals.
Regardless of which you pick, remember that volume quality matters! Unreliable data sources can skew the calculation and produce misleading signals.
Both VWAP and VWMA are technical indicators reliant on volume data. While one keeps track of the average price during the intraday session, the other calculates a rolling average across several sessions.
The best choice between them depends entirely on your trading system. A simple guideline says you should use the VWAP for day trading, while the VWMA should be used for swing trading.
Remember, you don’t have to exclude one in favor of the other. Many trading systems work very well by combining both indicators for broader trend assessment and optimized intraday entries.
In the end, regardless of what you decide to do, you must remember that consistent profitability comes from practice and risk management. Use a trading journal to test your system, review both successful and failing trades, manage risk carefully, and iterate. The more carefully you work with the data, the more confidently you can decide whether VWAP, VWMA, or both deserve a place in your trading system.