

The Average True Range Indicator for Volatility Trading
When volatility is high, the market accelerates. Prices swing up and down in large distances within a short window of time. But when volatility is low, things feel quiet and the market barely moves.
Volatility is highly important for traders. The effectiveness of your entire system depends on it. If you disregard it, then none of your plans make sense. Your take profit might be too far away, your stop loss might be too tight, and your entry trigger might never materialize.
The Average True Range indicator, created by Welles Wilder Jr., is a technical analysis instrument used for measuring market volatility. It tells you by how much prices have been moving. And this information is essential to plan for better stop losses, position size, profit targets, and exit rules.
The Formula for the Average True Range Indicator
If you search Google for ATR calculation and you’re not at all used to mathematical formulas, you might get intimidated by what you find.
Let’s divide the entire way the ATR is calculated into a 3-step process and you’ll see it’s very straightforward:
Step 1 – Finding the True Range
In this step, we’re going to take the maximum value among the items below:
- High minus Low
- The absolute value of High minus Previous Close
- The absolute value of Low minus Previous Close
Imagine a candle that has a high of 34, a low of 29, and a previous close of 31.
- High – Low = 34 – 29 = 5
- ABS(High – Previous Close) = ABS(34 – 31) = 3
- ABS(Low – Previous Close) = ABS(29 – 31) = 2
Note that with absolute value we’re getting only the figure, ignoring the +/- sign.
In this scenario, the maximum value is 5. This is the True Range (TR). The idea is that by measuring distance from the previous close, we can account for overnight gaps.
Step 2 – Average
In this step, we get the very first ATR, which is a simple average of the first 14 TRs.
First ATR = Average of the first 14 TR values.
Step 3 – Smoothing
The smoothing factor is responsible for bringing the volatility measure. The goal here is to give recent price movements a more meaningful effect, but without allowing one single session to take over the indicator.
ATR = [(Prior ATR x 13) + Current TR] ÷ n
Where n is the lookback period – usually 14.
How to Use the ATR Value
The ATR value tells you the magnitude of price movements within the lookback period. A higher ATR points to wider ranges or gaps. A lower ATR reflects a quiet market with narrow ranges.
When using the ATR indicator, traders tend to look at its own trend. A rising ATR often comes with expanding volatility, a wider price range, and more opportunities for entries and exits. A falling ATR points to a market narrowing down and prices moving within a shorter range.
And I’ll take this opportunity to say that the ATR says nothing about price direction. A large sell-off and a large rally will both produce the same ATR behavior, because they generate wider market swings.
To better understand whether bears or bulls are winning, you can use the ATR alongside the ADX indicator or the RSI and MACD indicators. With these, you will separate volatility from trend and/or momentum.
Adding the ATR to Your Trading Strategy
The ATR of a stock is mostly used for risk management purposes.
For stop losses and take profits, it’s better to use the current ATR instead of a fixed dollar amount. An initial stop or take profit could sit 1.5 ATR or 2 ATR away from the entry price.
Imagine a stock with a $2 ATR. With a 2 ATR stop, your stop loss level or take profit would be $4 away from the entry price. If volatility expands and the ATR rises up to $3, the same rule produces a wider $6 distance.
The ATR is also used for guiding trailing stops that adjust as the market moves. The trailing distance grows wider or contracts according to the indicator. This approach is more dynamic and makes your stop losses and take profits more aligned with the market, avoiding “unreachable” goals, as well as hitting stop losses too soon.
With the ATR, position sizing also becomes clearer by reflecting market speed.
Position Size = Risk per Trade ÷ Stop Distance
A volatile stock receives a smaller position than a calmer stock when both trades target the same risk factor.
Choosing the Best ATR Period on TradingView
The ATR is one of the best indicators for swing trading. One of the reasons why is that, although 14 is the standard period, you can easily adapt it to fit your trading system.
If you use TradingView, you can easily find the ATR on the Indicators Menu.
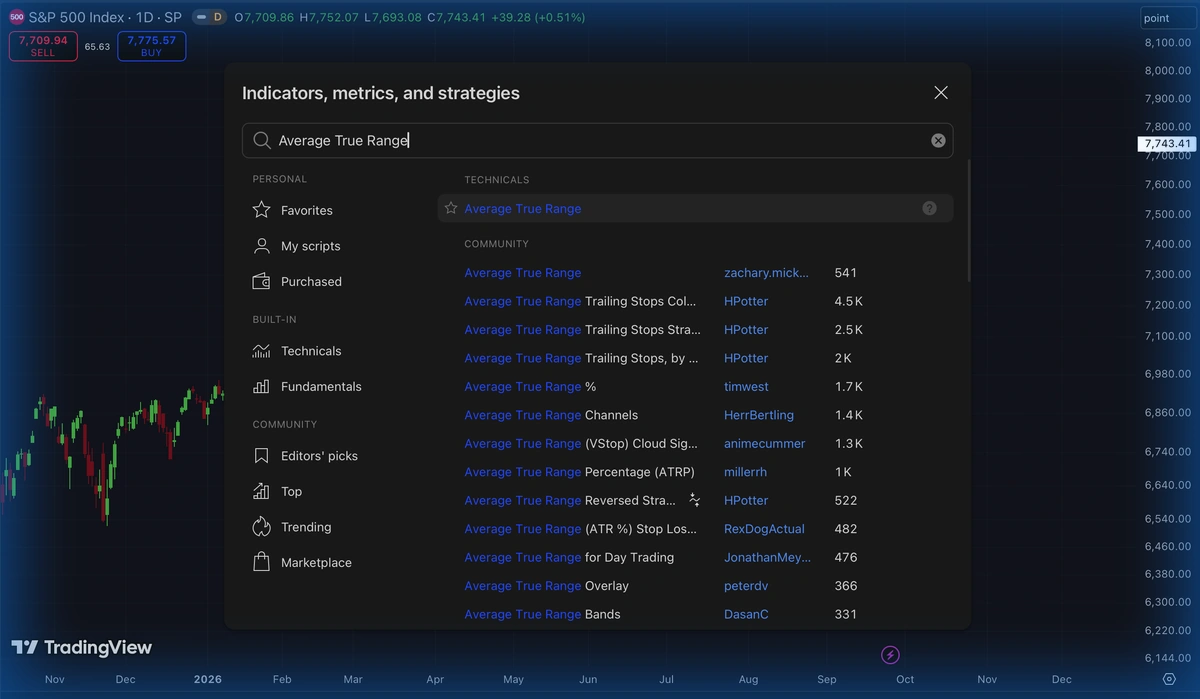
After selecting it, you can open the indicator’s settings to choose the length/period according to your own preferences:
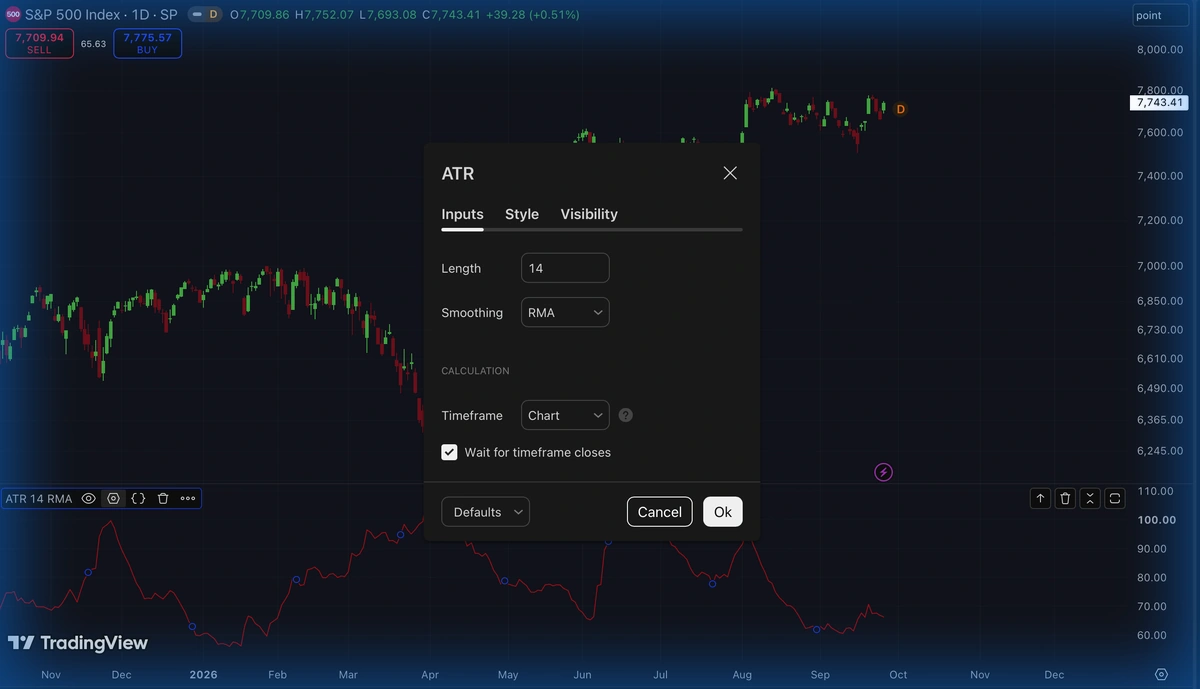
A shorter length is fast and reactive, easily capturing the most recent changes in volatility, and it’s the best use case for intraday analyses. Any ATR period within 5 to 9 fits this description.
If you want to calculate the ATR for a broader window and reduce the effect of short-term spikes, you can choose any period from 30 to 50.
But in general, for more general trading, the default 14-period ATR is suitable for everyone.
Limitations of the ATR and Why Use it Alongside Other Indicator
No indicator is perfect. You already know that.
An effective trading system is made up of at least 2, maximum 3, indicators. So one can provide strength where the other lacks.
The ATR doesn’t give you any directional signal. It only shines a light into levels of volatility to tell you whether market activity is high and prices are moving in wider swings. Both a strong rally and a panic sell-off can print the exact same behavior onto the ATR.
But if with the ATR you get the size of movement, you still need to capture momentum and trend.
A simple moving average gives you a better sense of direction. If prices are moving above it, you develop a bullish bias and if prices are moving below it, you develop a bearish bias. It also works as a dynamic support and resistance level, so you can use it to plan entries or take profit.
Another good indicator is the Bollinger Bands. It is also based on a moving average, but it comes with standard deviation bands around the price, which can help you measure whether the market is overbought or oversold, making it a great tool for mean reversion strategies.
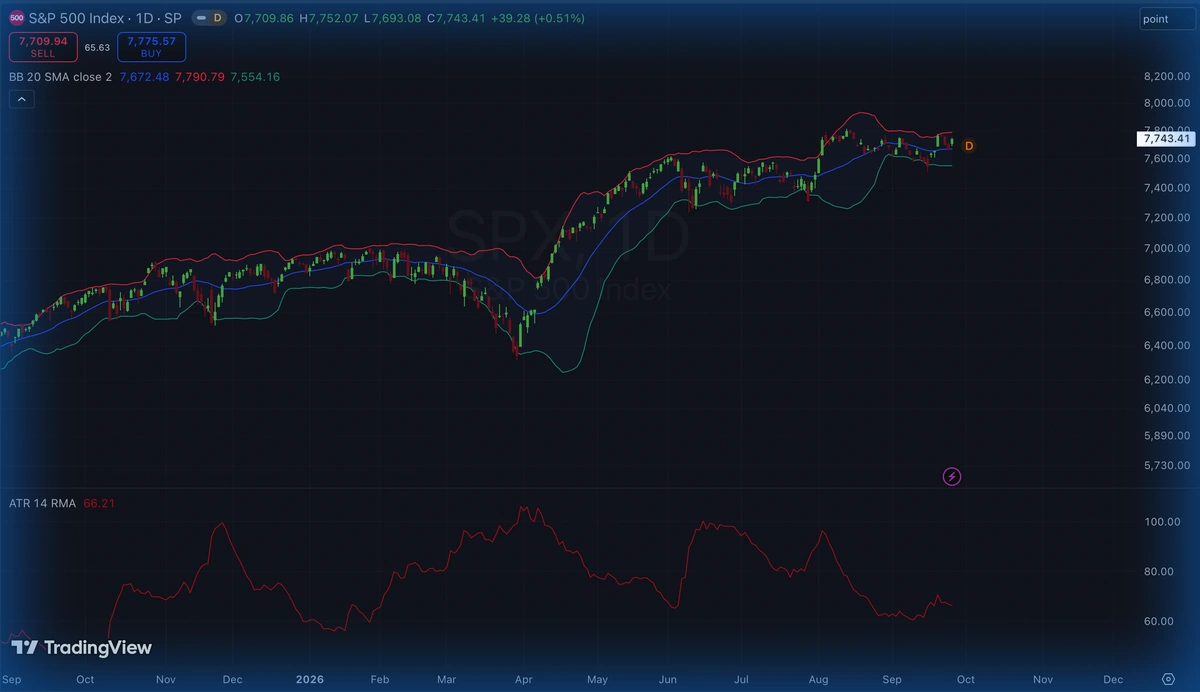
Closing Arguments
By how much has the market been moving?
This is the exact question the ATR provides an answer to. It doesn’t give you a sense of direction, momentum, nor entry. But it gives you great insight to plan your position size and adapt profit targets and stop losses according to the volatility.
If you combine it with other indicators (moving averages, MACD, Bollinger Bands, RSI, Stochastic Oscillator), the ATR is undoubtedly a powerful instrument for your market analyses in a day to day basis.
As I always say, backtest any new thing you bring to your trading system. Develop your own rules and try out different settings. See what works, what doesn’t. Ditch anything that is suboptimal and do it quickly. If you obsess over refining your strategy on a daily basis, your competitors will have no other choice but to be left in the dust.
FAQ – Frequently Asked Questions
What does the ATR measure?
The average size of price movement over a time window. Its main feature is that its calculation includes gaps, which captures a broader picture compared to a simple high minus low measurement.
What does a high ATR mean?
That the market has been moving on larger price swings, or even larger gaps. It doesn’t indicate whether prices are moving up or down.
Is 14 the best ATR length setting?
The ideal depends on your own preferences and goals, you don’t have to stick with the traditional setting. 14 is simply the default picked by Welles Wilder Jr when he developed the ATR.
Does the ATR predict the market direction?
No. The ATR is used to measure volatility. It doesn’t predict direction. That’s why it’s more adequate to combine it with additional analysis tools, like SMAs, EMAs, RSI, etc.
Can I use ATR for risk management?
Yes, this is where ATR shines the most. It’ll help you adapt position sizing, stop-loss and take-profit targets according to the market. That’s the most optimal way to avoid stop losses that are too tight and targets that are too far away.