
If you have opened a price chart before, you know that price tells you where the market is going. Either up or down. But have you ever wished you could pinpoint exactly where the larger chunk of price action happened during the trading session?
With trading volume, you can highlight price zones where the financial amount was the largest. At what price levels did the most relevant dollar amount of shares exchanged hands.
The Volume-weighted Average Price is an intraday indicator that perfectly captures the relationship between 2 of the most valuable pieces of information in financial markets: price and volume.
The VWAP keeps track of the average price paid for a stock while giving more weight to price levels with the highest trading volume. Intraday chart analysts use it to compare the current price with this benchmark and evaluate the directional bias of the session, while also pinpointing entry and exit areas.
So, what is VWAP? The VWAP is a financial indicator that displays the average traded price during a trading session and each price is weighted according to its trading volume.
While a regular moving average gives every observation within an x-time period the same level of importance, the VWAP gives more influence to price levels backed by heavy trading volume.
Let’s illustrate it by imagining two price levels: $50 with 100 shares traded and $55 with 10,000 shares traded. While a simple moving average sees both prices equally, the VWAP sees the $55 transaction as more important for the average price.
For day traders and scalpers, this behavior makes the VWAP useful in identifying the most meaningful points of trading activity. It also makes it easier to define the day’s winning side. If prices are moving above the VWAP, we have bullish victory. If prices are below it, we have a bearish victory.
At the beginning of each new trading session, the VWAP resets and starts all over again from the market open until the sessions ends.
How is VWAP calculated? The formula is simple to understand. Each transaction’s price gets multiplied by its own volume. The resulting values are summed together, and the total gets divided by the total volume at that point:
VWAP = Σ(Price × Volume) / Σ(Trading Volume)
The VWAP may look very similar to a moving average on a chart, but the Math behind them are based on distinct principles.
A simple moving average accounts for closing prices over a fixed number of bars. An exponential moving average is a little different. The most recent observations exercise a higher influence on it, but it still relies solely on price.
When the VWAP brings trading volume into the equation, it tells you whether current buyers and sellers are at an advantage or disadvantage compared to the day’s benchmark. With this information, you can evaluate whether the market is too “stretched” and measure euphoria/panic.
And speaking of daily benchmarks, the VWAP is used as such especially because it is an exclusively intraday indicator, resetting every morning. A 50-period SMA or EMA, on the other hand, include data from several trading sessions, looking 50 bars back, regardless of whether it’s looking at hours, days, weeks, or months.
| VWAP | SMA/EMA | |
|---|---|---|
| Uses price | Yes | Yes |
| Uses volume | Yes | No |
| Typical time frame | Intraday | Any |
| Resets each session | Yes | No |
| Main purpose | Intraday value and benchmark | Trend smoothing |
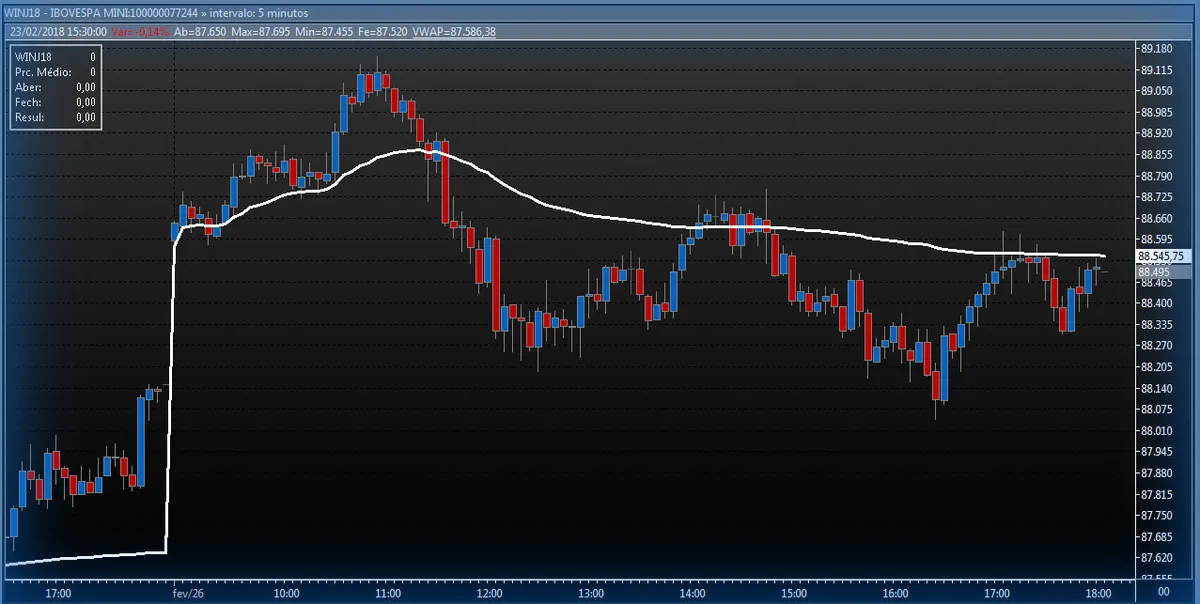
On an intraday chart, the VWAP line appears as a smooth line moving above or below the current price.
The way I interpret it works like this:
- Price above the VWAP = Bullish.
- Price below the VWAP = Bearish.
- Rising VWAP = Strengthening bullish trend.
- Falling VWAP = Weakening or bearish trend.
The VWAP also functions as a dynamic support or resistance, depending on the trend.
During an uptrend, the price may pull back towards the VWAP before moving higher. During a downtrend, the VWAP may act as a resistance level that keeps pushing the market down.
You can use VWAP in a plethora of trading strategies and for different things.
You can use it for:
- Market Bias
- Entries
- Exits
- Support
- Resistance
- Position Management
As with any other indicator, it works best when it is a component within a trading system instead of a single buy-or-sell signal.
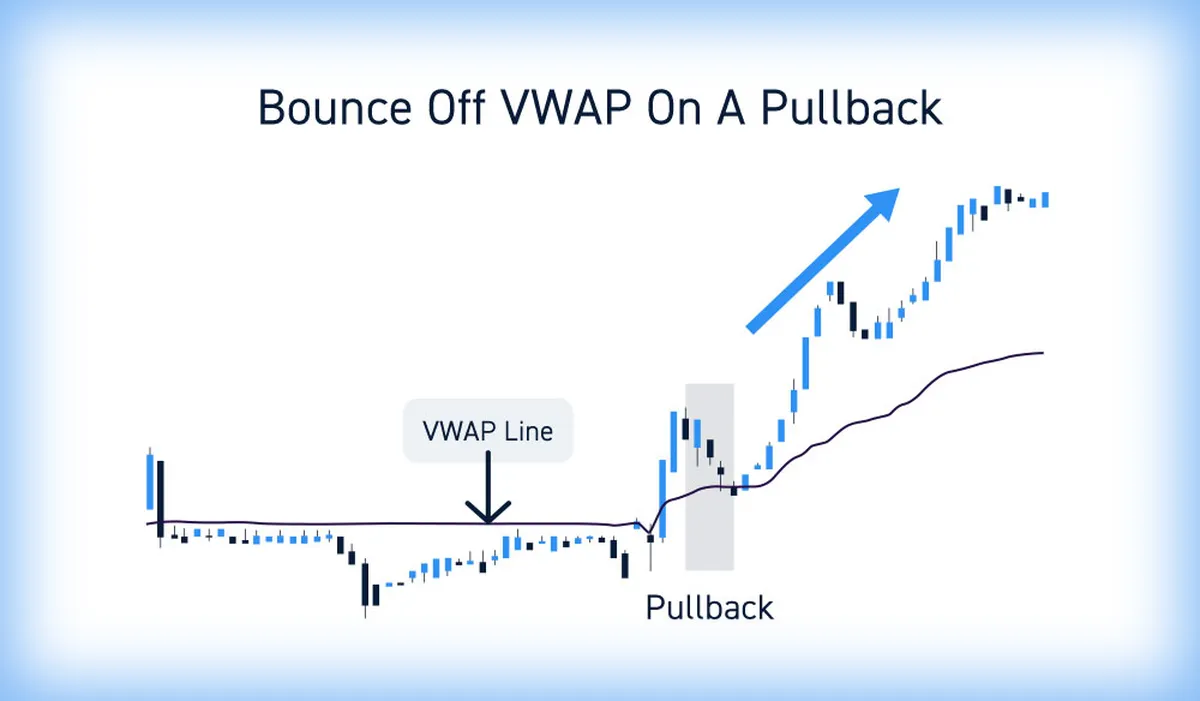
The VWAP bounce strategy is based on using pullbacks to get into an established trend.
So let’s Imagine a stock is trading above a rising VWAP. Instead of buying near the day’s high and risking an expensive stop loss, we wait for a pullback towards the VWAP.
Since the VWAP acts as a dynamic support level, a bullish reversal candle around it gives us an entry point with a take-profit aimed at at least the previous high.
If the market reverses, we get a cheap stop loss and a favorable risk-reward ratio.
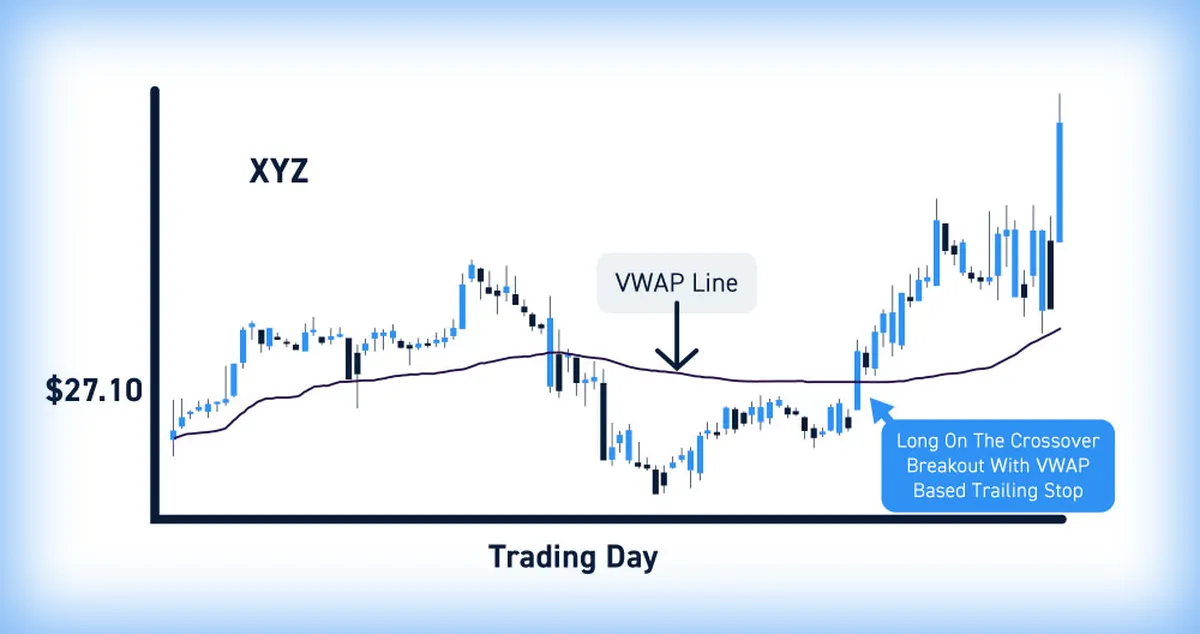
The VWAP breakout strategy is based on watching for price action to aggressively crossover the line.
If the market is moving around a flat VWAP and suddenly closes above it with a bullish candlestick backed by a higher financial volume, we can interpret this as a rising upward momentum, prompting us to evaluate a long entry. In this scenario, a stop-loss order sits slightly below the breakout candle.
But it’s important to highlight that volume becomes a crucial factor here, because it enforces that market participation is strong enough to kickstart a new trend.
Mean-reversion strategies are mostly used when the market is not clearly trending in a single direction. Neither bulls nor bears are able to drive prices, so the market keeps stuck within a defined range.
In this case, the market tends to become overbought and oversold when it deviates too much from the VWAP, so traders bet that it’ll soon move back to where the indicator is. Confirmation comes from a reversal candlestick pattern or with the help of momentum indicators.
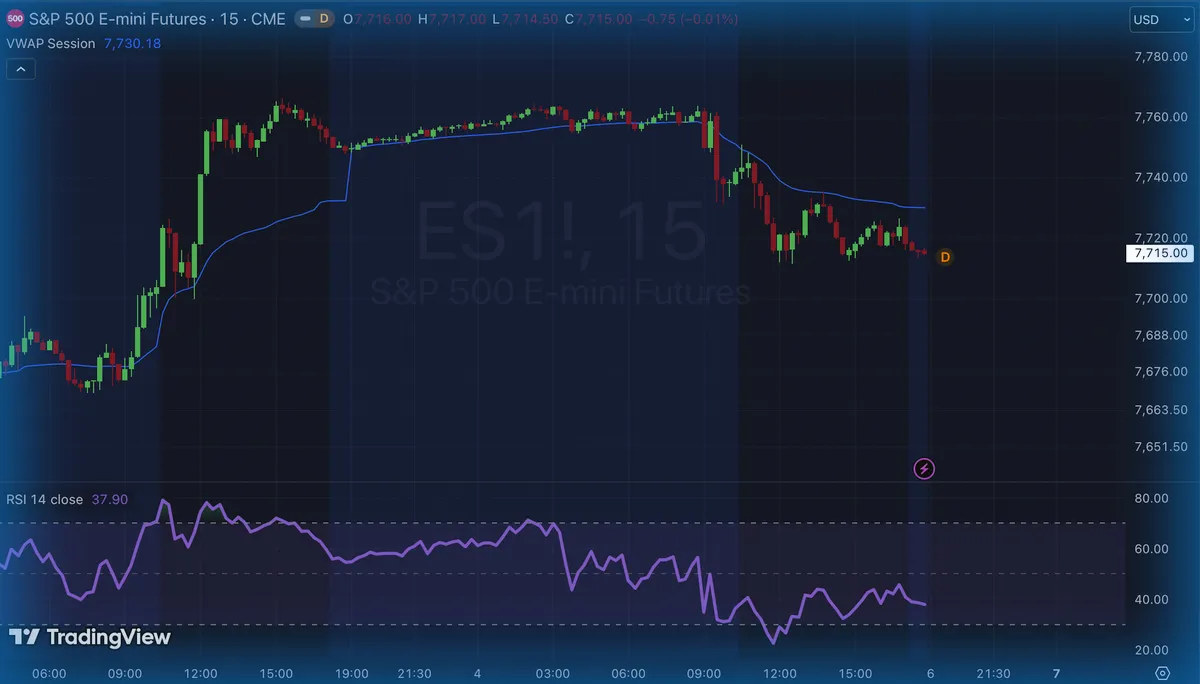
As I have previously said, the VWAP should not be used as a single entry-and-exit indicator. It works much better when paired with other signs.
Momentum indicators are helpful to define if the market is under oversold or overbought conditions, helping evaluate an entry level for mean-reversion strategies.
I genuinely believe a good trading system has at least 2 indicators. 3 at most. You can combine the VWAP with RSI vs MACD to highlight the market’s extremities, or study how momentum is evolving through the relationship between moving averages.
I highly suggest you read more about the best TradingView indicators for day trading so you can get some help on how to create a more complex technical-analysis system.
Every single indicator, no matter how good it is, comes with its flaws. The VWAP is no different and this is what you should watch for:
- It only applies to a single trading session. Since its calculation resets at the next market open, it doesn’t work for trend assessment throughout multiple days.
- It is, in essence, a lagging indicator. It suffers from the same “issue” as other moving averages. It accumulates historical data, so recent price action is still pushed back by older moves. In strong rallies, for example, the price may become detached from the VWAP without ever returning to it.
- The VWAP is completely dependent on volume data. If your trading platform doesn’t storage volume data, the VWAP won’t even be visible on the chart. Markets with low participation and volume deem the VWAP completely useless.
- In sideways markets, it produces many false signals, making it less reliable. Adapt your trading system according to market context.
- In periods of heightened volatility, such as major news events or announcements, it tends to become completely irrelevant, not being able to serve as resistance or support. Beware.
- It is extremely limited for Forex markets. Forex uses specific tick volume instead of a centralized volume data. For this reason, VWAP readings may vary a lot between different platforms, so it tends to be less reliable for most currency pairs.
FAQ
How do traders use VWAP?
Traders first start with an intraday chart, usually a 5-minute or 15-minute chart.
They add the VWAP through their platform’s indicators menu and use it to assess the daily trend.
Beginners can study how the VWAP bounces and practice entries with predefined stop-loss levels using a paper-trading account before risking their money in live markets.
Is VWAP used in FOREX?
Yes, but with an important data limitation.
Retail FX platforms don’t have a centralized data for trading volume, so their VWAP values work more as an approximation.
Is VWAP important for institutional players?
Yes, undoubtedly so.
Institutional players use VWAP as an execution benchmark. Large financial orders can get compared against the day’s VWAP, while algorithms split orders throughout the session to target an execution price closer to the benchmark.
Is possible to calculate VWAP in crypto?
Yes, crypto traders can use the volume-weighted average price technical indicator.
However, it’s important to highlight that crypto markets never stop, trading continuously 24/7.
Crypto traders have to plan carefully how they’re going to use the indicator, because it doesn’t have an official session reset.
Volume can also vary between different exchanges, so the readings may also differ depending on the data source.
Closing Arguments
In this article, you saw an overview of one of the most powerful indicators day traders use to study intraday price movements. The Volume Weighted Average Price indicator.
You saw how the VWAP is calculated. How it measures the relationship between price x volume traded. And how to trade with VWAP as a day trader.
Now that you’ve learned the theory, it’s time to transition to action.
For your next trading session, add the VWAP to your candlestick chart. Observe how it is used by market players and write down your questions and ideas.
Once you’ve understood how it can be added to your day trading system, start practicing with a paper-trading account. Analyze your drawdowns and performance. Iterate on it before you’re ready for live markets.
With persistence and hard work, you’ll see how much better the VWAP will make your trading system and help you determine key points for action in your sessions.