

FVG: Fair Value Gap Trading Strategy Explained
Fair value gaps, also called FVGs, are among some of the most widely used price action concepts in modern-day trading.
It has been popularized by the ICT school of thought and defines areas of extreme imbalance on price charts.
In essence, these are areas where large orders “skipped” through some levels, leaving behind an “untraded” zone that tends to attract the price back.
Traders usually watch FVGs for potential support and resistance zones or continuation areas.
Although FVGs have become popular in stock and currency markets, not all gaps on price charts are tradable. In fact, many of them are nothing but pure noise.
In this article, you will learn how to apply filters and use context instead of blindly trading every gap you see.
What Defines a Fair Value Gap? Meaning and FVG Explained
A fair value gap is an imbalance printed onto a price chart via the relationship of three candles.
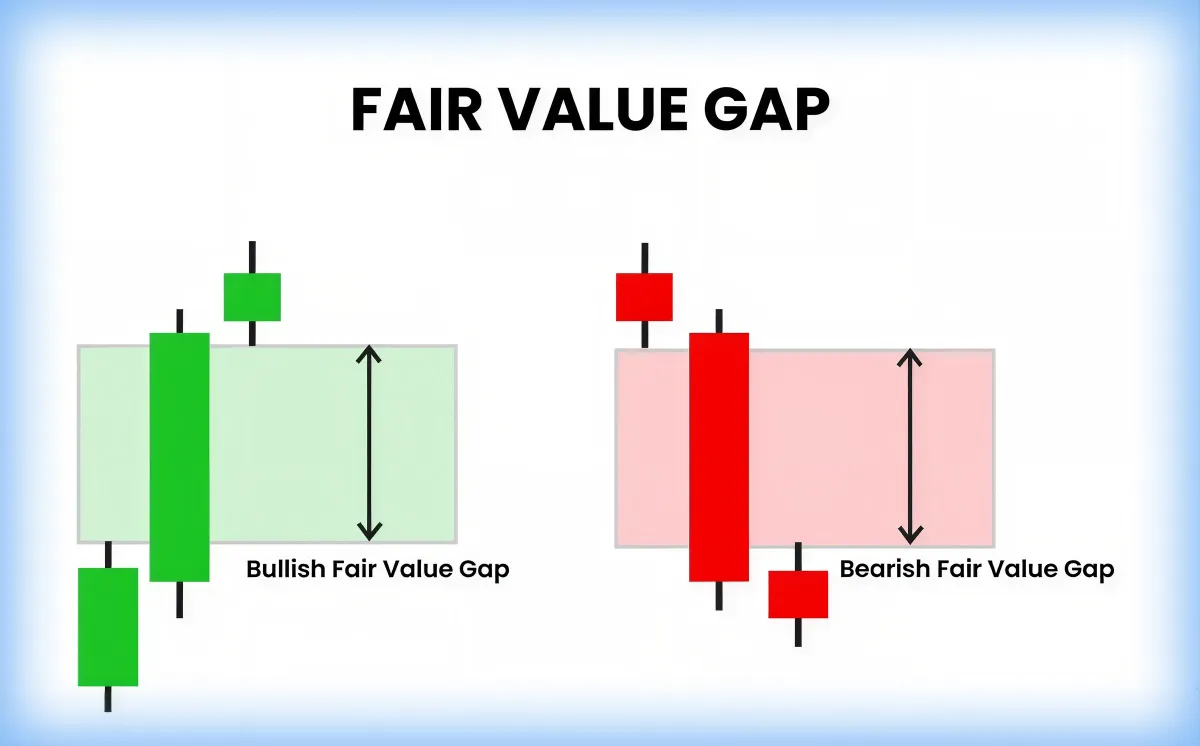
The strong candle you seen in the middle is called “the displacement candle”. It moves so quickly that its body leaves a void between the first and third candles.
A bullish FVG is characterized by a three-candle sequence where the middle one is unusually large and the high of the first candle is located below the low of the third.
A bearish FVG follows a similar pattern, but the low of the first is above the high of the third.
But what causes this large candle in the middle?
The answer depends on the broad context. But, in general, this movement is attributed to large institutional orders, the smart money, pushing the price so violently that buy and sell orders are unable to be executed in that range.
And why have technical analysts observed that prices tend to retest this zone?
Because an FVG marks a price range in which the fair market price skipped through without a full auction in between, which is seen as a temporary market inefficiency.
Identifying an FVG on Price Charts
Spotting an FVG on Japanese candlestick charts is straightforward once you know the pattern rules.
First, locate a massive momentum candle that dwarfs the surrounding price action.
Second, ensure that the previous candle and the subsequent candle don’t have overlapping highs and lows.
The middle candle’s body will usually align with a box that marks the fair value gap.
For a bullish fair value gap, the box is in between the high of the first candle and the low of the third candle.
For a bearish fair value gap, the box is in between the low of the first candle and the high of the third candle.
Keep in mind that the middle candle should be a strong Marubozu-like bar, with its body representing over 70% of the candle, with very minimal wicks. The adjacent candles should not overlap the middle bar too much.
Don’t forget that the gap must be quite recent and unfilled. If it has been revisited already, it ceases to be a significant signal.
The Inner Circle Trader (ICT) Theory for Understanding the Market Psychology Behind FVGs
According to the ICT theory, the market works as a conjunction of liquidity-seeking forces.
When an institutional order is so massive that the price jumps over buyers and sellers, we’re left with a huge imbalance between supply and demand.
Market makers will then drive the price back to these zones to collect all of that liquidity.
In periods of heightened volatility such as this one, market sentiment becomes highly anxious.
Those who have missed the initial breakout will wait for a pullback to get in.
They place their orders at the gap, believing that prices will move even further in the direction of the FVG.
This behavior creates a self-fulfilling prophecy, because prices are “forced” to retrace, fill the void, and then resume the original trajectory.
Using Fair Value Gap Trading Strategies
Trading fair value gaps effectively is about using them as potential entry or exit points.
The basic strategy is to wait for the price to return to the gap, then trade in the gap’s direction.
A simple step-by-step would be:
- Identify a valid FVG on a chart using the rules outlined above. The best FVGs appear mid-trends!
- Allow the price to pull back into the boxed zone and wait for a retest of the gap.
- Confirm the bias, then trade in the gap’s direction. Go long for bullish gaps. Go short for bearish gaps.
- Place entry orders just inside the FVG zone.
- Set a step-loss just a bit outside the box boundaries, according to the directional bias.
- For take-profit targets, you can either project the box onto the bias direction or aim for the next significant support or resistance levels.
- Risk management is the most important factor for long-term survival. If the price never retests the gap and keeps moving forward, stay out. If the price fills the gap and doesn’t move in its direction, the FVG is invalid and you should exit as quickly as possible.
Let’s take a look at an example below.
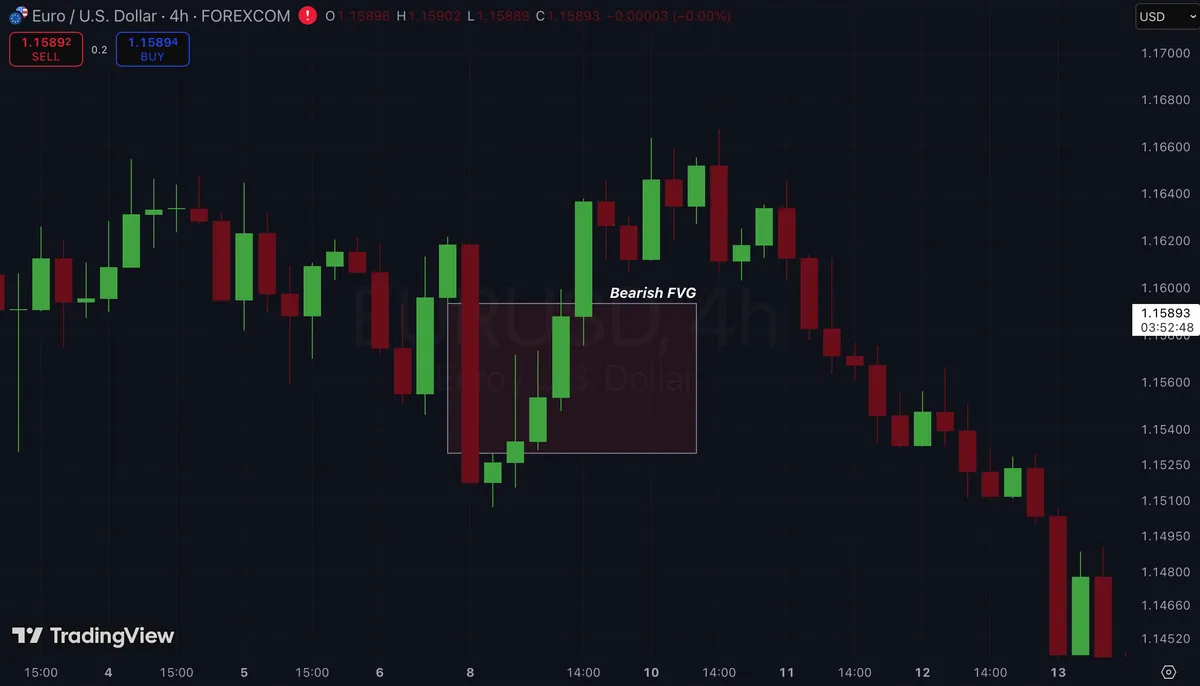
We have an intraday chart for the EUR/USD currency pair.
The first thing to notice is that there isn’t a clear trend preceding the formation. The market appears to be sideways.
A large, Marubozu-like red candle emerges and forms a bearish FVG. Most traders would then wait for the pullback to retest the gap, and go short to profit from a bearish downtrend.
The candle that succeeds the third candle of the FVG tells us an interesting story. It has a small body at the bottom and a large upper wick. It shows us that bears have pressured prices down during the pullback, probably forecasting a downtrend.
However, in each new candle within the gap, bulls have started to gain more dominance, weakening bearish pressure.
A large, green candle breaks out the upper boundary of the gap, closing at its highest point, probably fueled by stop-loss orders set by many short-sellers who entered inside the gap box.
Although prices did in fact go down later on, bulls were able to push prices up and keep it above the FVG for a while.
This is a real-world example that patterns can and will fail, but risk management and stop losses are to be used if you want to come back to the market the following day.
Optimal Time Frames and Markets to Identify Fair Value Gaps
In general, these gaps are rare in higher timeframes, with much fewer setups in daily and weekly charts. But, when they happen, they result in support and resistance levels with much more weight.
However, intraday charts are what you’re looking for if you want to trade gaps. FVGs are much more common and feasible in 15-minute, 30-minute, and hourly charts.
For specific markets, we should look for high volume and volatility. The S&P 500 Futures, major Forex pairs, and large-cap cryptocurrencies provide the best grounds for entry and exit points.
The Inverse Fair Value Gap
At this point, we have only talked about fair value gaps as a continuation concept. That is, a bullish FVG will attract prices to a pullback and the market will move back up towards an uptrend.
But that’s not what always happens!
An inverse fair value gap occurs when a gap is broken through by the price. So, in the case of a bullish FVG, the gap forms and is later pierced downward. If the gap didn’t work as a support zone for a bullish trend, it will now act as a resistance zone if bulls attempt to push the market back up.
Incorporating Value Gaps Into Your Trading with Different Indicators
To improve your trading decisions, it is always a good idea to combine different technical analysis techniques when evaluating price movements.
FVGs definitely tell us something about how institutional players might be moving and how that psychologically affects market participants, but additional indicators help us confirm the directional bias and assess the strength of the signals we’re spotting.
I highly suggest you take a look into some TradingView indicators for day trading to find the ones more suitable for your trading style.
Some great indicators to use in conjunction with FVGs are:
- Fibonacci retracements: Great to align FVGs with key Fib levels to filter weak gaps. FVGs aligned with the 61.8% Fib retracement is potentially a strong gap.
- Oscillators and divergences: Overbought and Oversold levels can help you define more optimal entry and exit points.
- Order blocks and order flow: Essential smart money concepts. When FVGs coincide with institutional order blocks, many traders will mark that price level, which makes it extremely strong.
- Market structure and trend: Always consider the broader market context. Ideally, FVG trades should go with the prevailing trend.
Risk Management and Common Mistakes in FVG Trading
Risk management is important because, at the end of the day, the markets don’t owe us anything.
Gaps may remain unfilled forever.
If you start your trading day with the assumption that gaps are a guarantee of reversals, pullbacks, or any other thing, you’ll be vulnerable to catastrophic drawdowns.
Traders may interpret every gap as an opportunity. But without market context, it’s impossible to say if you’re standing in front of an effective FVG or just an empty space that doesn’t really have any meaning behind it.
Risk management is all about adhering to strict trading rules. Always trade in the direction of the dominant trend. Don’t risk over 2% of your trading capital in a single trade. Always have a stop loss in place, in case things go wrong. Beware of trading during major news events, when markets are irrational and volatile and unpredictable price moves can easily destroy technical setups.
Step-by-Step Guideline For Your First FVG Strategy
So you want to add FVG strategies to your trading system.
Here’s a step-by-step plan:
- Choose a liquid market such as the EUR/USD currency pair or the S&P 500 Futures.
- Look for a recent three-candle structure that meets the FVG criteria (large middle candle and no overlap between candle 1 and 3). Confirm it aligns with the dominant trend.
- On your chart, draw the gap box from candle 1’s extreme to candle 3’s extreme. This is your imbalance area to watch.
- Check timeframe alignment. If the gap is also visible on a higher timeframe, you have additional confidence to act.
- Wait for a pullback. Your entry point lies inside the box.
- Confirm your entry signals with additional indicators. An oscillator or volume spike gives confirmation.
- Enter the trade in the gap’s direction. If bullish, go long. If bearish, go short.
- Set a stop-loss order and a take-profit order. Your stop loss should be placed just outside the gap zone. For take-profit, many traders project the box in the direction of the trend. Some prefer aiming at the next structure level or using a risk-reward rule such as a 1:2.
- If the price, for whatever reason, never comes back to the gap box, stay out. If it pierces through, consider the pattern invalid.
- After the trade, review the outcome. Add a log into your trading journal describing what took you into entering the trade, what the results were, and what could be improved next time.
Conclusion
After you learn about fair value gaps, the entire way you evaluate price charts changes.
Gaps that appear as empty spaces are now much more than just that. They’re hidden imbalances that uncover where institutional players left their footprints.
When you recognize these zones, you stop chasing trades and start waiting for the most effective pullbacks.
But as you know, the path toward success requires a lot of patience and studying.
Not every gap is equal and the market punishes indiscipline.
Take your time to study historical charts and refine your analysis. Keep adherence to risk management rules and dedicate yourself to continuous education. That’s what separates amateurs from professionals.
As you start using FVGs in your trading activities, you’ll see how that shifts your perspective on how prices move.