

Break of Structure: BOS Trading Strategy Explained
Since the late 1990s, algorithms have become one of the main drivers of price action in financial markets.
As a retail trader, you don’t want to fight against them!
Many people lose money in the stock market because they fail to understand the most complex chart mechanics. They have spent countless hours studying bearish and bullish candlestick patterns, indicators, and volume profiles, but they’re still oblivious to smart money concepts.
In this article, you will learn one of the most valuable skills when it comes to reading price action effectively. We will walk through the Break of Structure (BOS) and understand how to trade it successfully.
What Does a Break of Structure Mean in Theory?
A break of structure in trading is seen as a confirmation of trend continuation.
Let’s imagine a downtrend. In this case, the market is structured as a continuous progression of lower highs (LH) and lower lows (LL).
A bearish BOS is confirmed when the price drops below the most recently established lower low. This is the main signal that the dominant market players, the ones driving the macro trend, have successfully absorbed all counter-trend liquidity and have enough capital to push the price further in their directional bias.
In other words, we have a confirmation that supply overwhelms demand. Institutional sellers remain in absolute control of the market and will drive the downtrend even further.
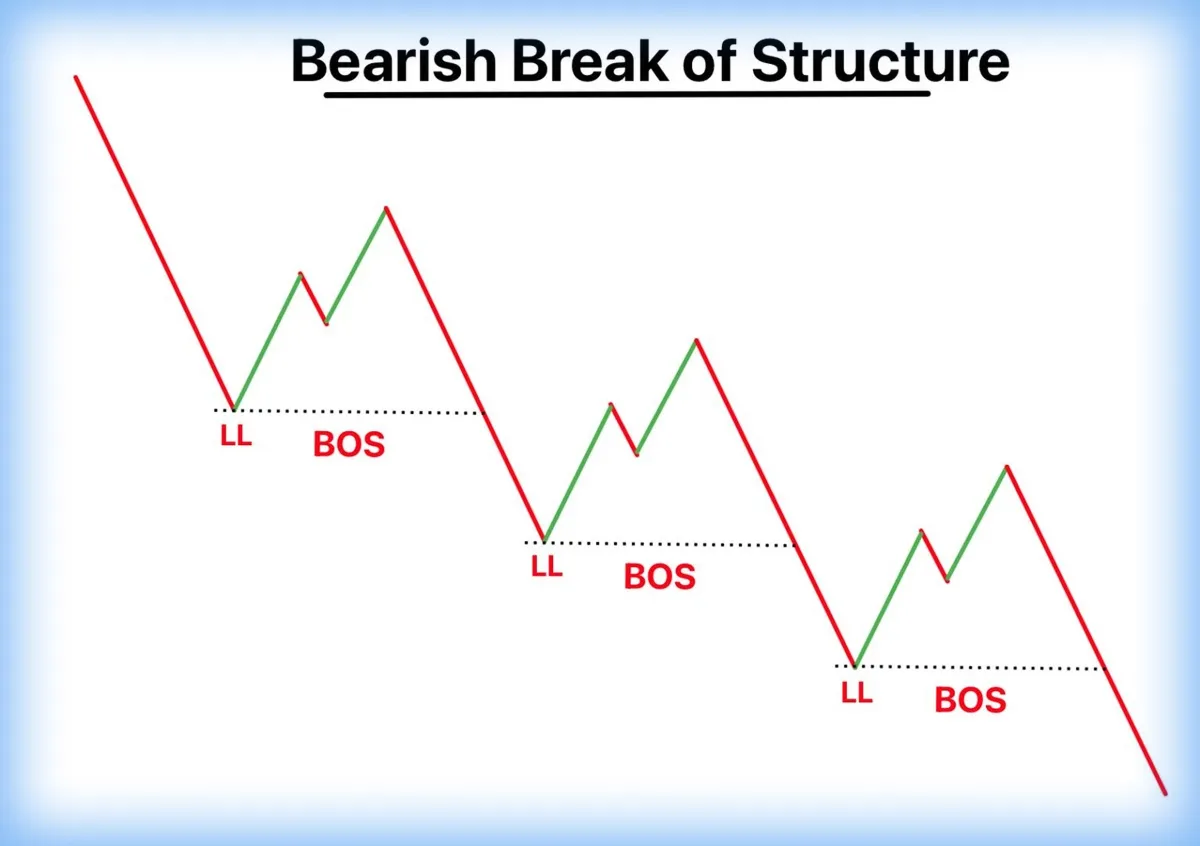
Identifying a Break on a Chart for the Best Trade
It can be a bit tricky to identify a BOS on a trading chart. Although you can find some community-built indicators on platforms like TradingView, they’re not very reliable.
The main tip is to view the market as a continuous structure of highs and lows.
- Start by establishing the directional bias, since a BOS can only happen in the direction of an already established trend. When evaluating a market, ask yourself:is this a bullish trend or a bearish trend?
- Beware of algorithms manipulating price slightly past an old high or low just to trigger stop losses and then immediately pull the price back. This can leave some long wicks protruding through the structural level, which many retail traders misinterpret as a true breakout – it isn’t!
- A genuine BOS requires a full candle body closure beyond the extreme wick of the previous structural pivot.
- A bullish BOS only happens within the context of a bullish trend. The market is then structured by a sequence of higher highs (HH) and higher lows (HL). When prices pullback from a peak to form a higher low, it can never move below the preceding HL. A bullish BOS will only be confirmed the exact moment a candle closes its body above the previous higher high.
- A bearish BOS only happens within the context of a bearish trend. In this case, prices are formed in a consistent sequence of lower highs (LH) and lower lows (LL). When corrective rallies happen, a lower high will form, and it is crucial that it remains below the previous LH. A bearish BOS is validated once a bearish candle closes its body completely below the prior lower low.
BOS vs MSB Analysis
Within smart money concepts, besides the Break of Structure (BOS) we also have something called the Market Structure Break (MSB), which is also sometimes called the Change of Character (CHoCH). These are two phenomena that communicate opposing messages regarding the market’s future.
To make it simple, a BOS means that the current trend will continue. An MSB or CHoCH serves as a warning that the current trend might be failing and a macro reversal could be imminent.
| Break of Structure (BOS) | Market Structure Break (MSB) / CHoCH | |
| Primary Function | Confirms trend continuation | Indicate a potential trend reversal |
| Structural Action (Downside) | Price breaks the previous lower low (LL) | Price breaks the previous lower high (LH) |
| Structural Action (Upside) | Price breaks the previous higher high (HH) | Price breaks the previous higher low (HL) |
| Institutional Implication | Dominant side maintains control and consumes liquidity | Control transfers. The institutional order flow shifts direction |
| Trader Response | Maintain directional bias and seek pullback entries in the same direction | Abandon any previous biases and prepare to trade the new reversal direction |
| Price Action Characteristics | Steady flow into the direction of the macro trend | Sudden and volatile displacement against the prevailing trend |
Real-World Example
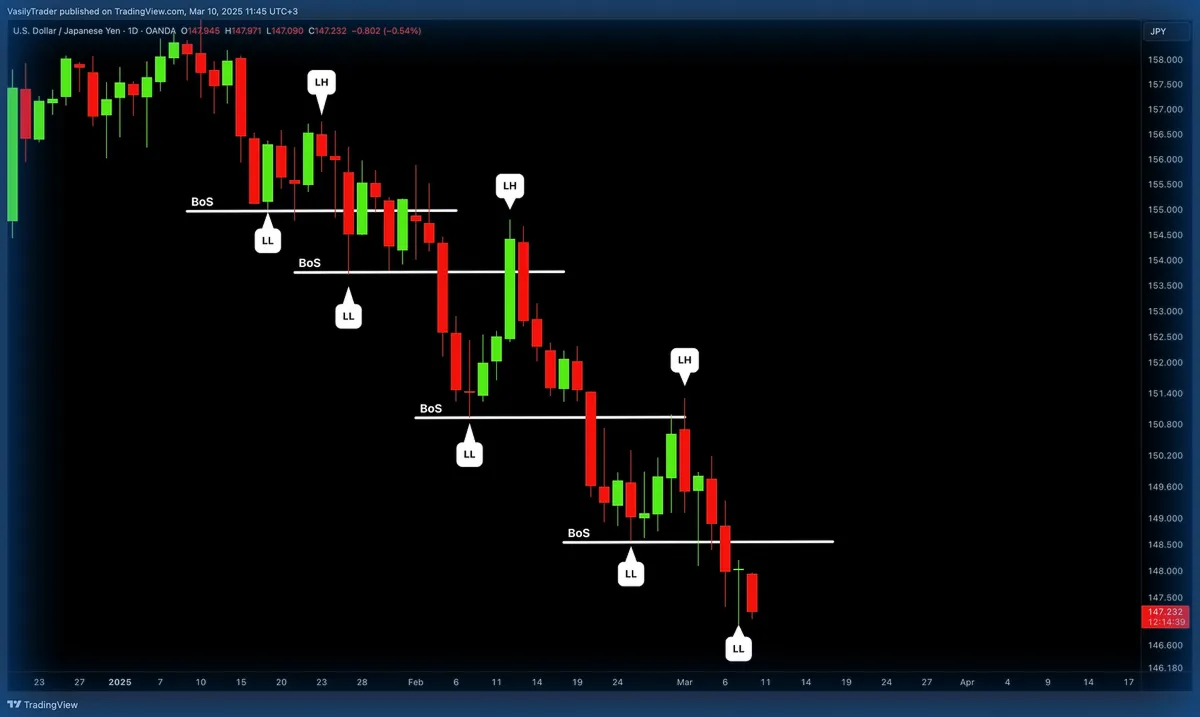
Take a look at the U.S. Dollar / Japanese Yen Forex pair on a daily chart above.
You can see how the market has been plunging down from the 158.000 zone, designing a classic bearish structural flow marked by lower lows (LL) and lower highs (LH).
Each time the price breaks through a previous LL, a definitive candle body closure validates the BOS.
Also notice how every single breakdown triggers a corrective rally back to the broken level, which allows institutional players to short at a premium before driving the market back down towards 147.200.
If you were trading this specific scenario, you would only enter a short position after the price makes a retest of a broken horizontal BOS line (e.g., the pullback towards 151.000). Your protective stop loss would be slightly above the previous lower high (156.000).
Your take profit target would be directly at or marginally below the previous bottom, somewhere around 148.500 or 147.000.
Using Multiple Time Frames for an Enhanced Strategy
One of the most effective ways of trading a break of structure is through a top-down mapping strategy.
In other words, you’d typically use a daily or 4-hour chart to map out the dominant trend. If, for example, you identify the market has been consistently printing lower highs and lower lows, you would operate under one strict rule where only short positions make sense.
Any bullish lower timeframe shifts would be seen as a temporary pullback against a stronger downtrend.
Only after identifying the main trend in a daily or 4-hour chart, you would drop down to an intraday 5-minute or 15-minute timeframe. This is where you’d define precise entries.
Always wait for behavioral confirmation before opening a position. Do not underestimate the role of institutional volume in price action. Any market move without trading volume is not as reliable as one backed by a large increase in volume.
Stop-Loss & Take-Profit Orders
While trading Smart Money Concepts (SMC), risk management continues to be paramount. And it dictates exactly where you exit a position.
One of the main benefits of the structural pivots found in BOS is that it gives objective price zones where you can take profit or stop loss.
Within a bearish trend, your stop-loss order must be placed slightly above the upper wick of the previous high. This placement will protect your capital from algorithmic liquidity hunting.
If prices close a candle body above this protective high, a macro bullish CHoCH is triggered. In this scenario, it is better to accept a calculated loss and exit right away.
While taking profit, you must remember that SMC methodology focuses on liquidity pools. In a downtrend, the main concentration of this liquidity is found slightly beneath the most recent lower low, where sell stop orders are positioned.
To guarantee the success of your trade, your main take profit must be positioned precisely at this point.
It is always a good idea to employ a partial profit-taking strategy. So you can save a percentage of your entire position (10% or 20%) to target deeper liquidity pools. This will provide massive asymmetrical risk-reward ratios.
Filtering Methods and How to Avoid False BOS
With BOS you have to be careful about algorithms engineering fake-outs (false breakouts) to trap retail traders only to absorb their stop losses later on.
Institutional players are constantly moving prices to absorb liquidity provided by unsuspecting retail participants.
That’s why it is important to remember that breaks of structure are not entry points. They are simply a confirmation of trend continuation. If you enter the market when a BOS happens, you risk getting stuck in a false breakout and you will have a huge path towards your own stop loss, which makes you vulnerable to massive drawdowns
Here are some filtering criteria to validate a BOS and avoid false breakouts:
- A real BOS requires a full candle body that closes below the extreme wick of the prior low during bearish trends. The inverse is true for bullish trends.
- Limit your executions to high-volume windows like the London or New York open. This will protect your account from meaningless algorithmic noise.
- Keep watching for relevant candlestick patterns or indicators you deem helpful. They will provide you an excellent early warning system, which will drastically reduce your exposure to institutional traps.
Common Mistakes
The most fatal error is executing orders immediately upon the structural break.
Selling exactly when a support line breaks means you will enter the market at a profound discount.
The big money is found when buying at a discount and selling at a premium.
Opening a short position right after a BOS means that you entered the market at a moment it prepares for a corrective retracement. A pullback.
The optimal entry point is within the pullback, because that’s where you will be able to short sell at a premium point of interest.
Never forget to only execute when both the higher timeframe and lower timeframe are perfectly aligned.
Conclusion
Smart money concepts are complex, but highly worth studying.
Most retail traders have no idea of how strong breaks of structure and changes of character are when trading in a bullish trend or bearish trend.
Of course, it takes a lot of unrelenting patience to truly master BOS and CHoCH.
Markets engineer traps on a daily basis, so it’s easy for retail traders to lose money during fake-outs, providing liquidity for institutional players.
You must study and refine your trading system every single day.
Occasional losses are a part of the process, that’s why risk management is paramount to guarantee long-term survival. Be fierce with capital protection.
With SMC methods, you’ll place yourself way ahead of your competition. Keep pushing forward!